2013 Forisk Timber Price Forecast: Assessing Forest Supplies and Price Elasticities

9 04 2013

This is the sixth in a series related to Forisk’s 2013 forecast of softwood stumpage prices in the United States.

When housing crashed in the United States, forest owners and timberland investors deferred harvesting sawtimber, the logs needed to manufacture lumber.  In 2012, Forisk added a “forest supply module” to its forecasting of pine stumpage prices to estimate potential supply effects on timber prices.  Today, the theory that pine grade accumulated, possibly to excess, on the stump in the U.S. South is holding water. Historical research and quantitative relationships reinforced the notion that (1) stumpage prices would lag increased demand and pricing for softwood lumber and (2) excess forest inventories could further dampen pine sawtimber price recovery.

Quantitative evidence confirms that pine grade stumpage prices lagged increases in softwood lumber prices.  And the slow recovery of pine grade prices in 2012 showed greater dampening than estimated by the Forisk Forecast. South-wide, actual 2012 pine sawtimber prices in the South were 1.6% lower than Forisk’s estimate.  At the state level, pine sawtimber prices were, on average, $0.21 per ton lower than forecasted by Forisk.  While we cannot claim or confirm causality – we cannot prove that oversupplies produced slower growth in pine grade prices –we can establish the relative consistency in the story of demand-versus-supply across states.

States with the most severe pine grade “oversupplies” showed material decreases in their price-to-demand relationships over the past five years.  In other words, stumpage prices became less sensitive to increases in demand in those states for which a quantitative basis exists for significant excess inventories.  This includes states, for example, such as Georgia and Mississippi.  While these estimates do not specify the situation in any given wood basket or for any given timberland property, they do support the evidence that supplies have affected stumpage markets selectively.

In 2013, our research into the effects of forest supplies on stumpage prices focus on distinguishing “supply effects” from “demand effects.”  Why?  The key is to avoid double-counting the impact of excess supplies.  If prices temporarily become less responsive to demand in a given state or market, we can “plausibly” attribute this, in part, to the supply situation.

To learn more about the 2013 Forisk Forecast or Forisk’s market-specific stumpage forecasts tailored to individual wood-using facilities or timberland ownerships, contact Brooks Mendell at bmendell@forisk.com, 770.725.8447. 


Forest Finance: What is Timber “Depletion”?

10 03 2013

Money does grow on trees.  Unfortunately, it grows in small denominations.  So we care deeply about managing costs and minimizing taxes.  Which brings us to a category of questions I get each tax season:  timber depletion.  What is it?

Depletion, like depreciation and amortization, is a cost recovery method for natural resources.  It comprises the costs we have in the timber we own and harvest.  We subtract depletion from timber stumpage revenues to arrive at taxable income.  (Therefore, we want depletion rates as high as possible!)

There are two general methods for calculating depletion: tax depletion and financial depletion.  Tax depletion is based on the actual cost of the timber, adjusted annually for additions (acquisitions), removals (harvests), annual net growth, and capitalized reforestation costs.  The depletion “rate” for a corporation is capitalized silviculture dollars divided by the merchantable forest inventory

Financial depletion, also called “normalized” depletion, sums all capitalized silviculture expenses plus merchantable timber accounts and divides this by the beginning inventory plus all growth over the rotation.  The idea is that this should represent the initial cost of the timber plus all ongoing capitalized silviculture expenditures (all capitalized costs associated with wood production) and all the wood that is grown.  This approach provides an “average rate” over the rotation rather than a rate that can change drastically over one rotation.  You will find this method in financial reporting by publicly-trade entities. Private entities (S-Corps, LLCs, Partnerships) generally do not keep a set of financial reporting books.

In summary, depletion reduces the taxes we pay on revenues produced from harvesting and marketing timber.  Publicly-traded firms generally report both tax depletion and financial depletion.  At the end of the day, the objective is to MINIMIZE taxes paid within IRS guidelines….


How Financing Signals Viability and Risk for Wood Bioenergy Projects

6 02 2013

This post summarizes research from the January 2013 edition of Wood Bioenergy US (WBUS).

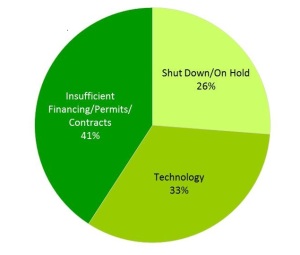
Viable wood bioenergy projects can secure competitive financing.  In U.S. capital markets, primary sources of financing for these projects include private equity, project finance, grants, loans and bond issuances.  Decreased availability of financing represents one of the top three responses – along with legislative uncertainty and low natural gas prices – from managers of idled or failed wood bioenergy projects tracked by Forisk from 2009 through 2012.  Bioenergy plants must compete with other bioenergy projects for financing, as well as with projects of all types in different industries. Of the 164 projects that fail Forisk’s viability screening, at least 41% explicitly lack sufficient access to capital to advance towards construction.

Figure:
Reasons Announced Wood Bioenergy Projects Fail Viability Screening

20130206 wood bioenergy

Recent announcements regarding financing for projects indicate how investors view different bioenergy technologies and markets.  Financing cannot be ordered at the drive-thru window. The ability to secure financing from a lender indicates some level of confidence and manageable risk in the eyes of investors.  It requires project developers to demonstrate a robust business model or ongoing concern with a proven track record.  For wood bioenergy projects with unproven technologies, developers must turn to government funding sources or to private equity investors with appetites for higher risk.  The wood pellet industry, while facing uncertain growth, has established its viability; a track record of operational success is the best proof of creditworthiness, affirmed by the sector’s access to cheaper, traditional debt financing. Cellulosic ethanol and other biofuel projects remain high risk with a challenging road to commercialization.  These projects rely on government funding, such as programs through the Department of Defense, and costly private equity.

WBUS Market Update:  As of January 2013, WBUS counts 461 announced and operating wood bioenergy projects in the U.S. with total, potential wood use of 132.9 million tons per year by 2023.  Based on Forisk analysis, 296 projects representing potential wood use of 76.2 million tons per year pass basic viability screening.  To download the free WBUS summary, click here.


Forest Finance: “Drive-By” Timberland Valuations

3 02 2013

Want a simple method for valuing stocks and income earning real estate or timberland?  Consider the Dividend Discount Model by dividing next year’s income, assuming it will be earned annually in perpetuity, by a constant discount rate or cost of equity.

20130203 Forest Finance figure 1

For example, assume that Forisk stock pays $1.00 per share annually in perpetuity.  How much would you be willing to pay per share if you required a 10% rate of return?  According to the Dividend Discount Model, you would pay $10 per share.

20130203 Forest Finance figure 2

If we think about this model with forestry investments in mind, assume a timberland ownership generates $100 of net income per acre per year.  Applying a 6% discount rate in the Dividend Discount Model ($100/6%) gives a valuation of $1,667 per acre.  For those of us in timber, we can see that this approach gets us “in the ballpark” and provides a simple approach for “drive-by” valuations…..

Click here to register for “Applied Forest Finance” on February 7th in Atlanta, Georgia.  The course details necessary skills and common errors associated with the financial and risk analysis of forestry-related investments. Registration includes copies of our “Forest Finance Simplified” handbook.


Forest Finance: When is the “Current Stand Approach” Useful for Valuing Timberlands?

30 01 2013

When talking about timberland investing while having a beer or standing over the hood of a truck, not when signing checks or allocating capital…..

A reasonable estimate of a forest’s current economic value equals the standing merchantable volume multiplied by the current stumpage prices in the local market. Investors sometimes use this “back-of-the-envelope” technique to estimate the liquidation value of a timberland investment or forest-owning firm. However, this basic approach suffers from observable, value-destroying limitations.  Why? It ignores the potential for generating greater wealth by holding the forest to economic maturity, investing in forest management, identifying other revenues, or accounting for taxes or opportunity costs associated with the land and capital.

This snapshot value faces other weaknesses.  First, current realizable values for the standing timber will be low at any given point in time.  Also, for large timberland ownerships or plantations, the local market can rarely absorb a total liquidation (clear cut) of inventory without depressing local prices.  From a valuation standpoint, the former incents conservatism and the latter incents unreasonable optimism.  Generally, appraisers valuing forests completely avoid current stand valuations (in writing)…..

Click here to register for “Applied Forest Finance” on February 7th in Atlanta.  The course details skills and common errors associated with the financial and risk analysis of timberland and other forestry-related investments.


Forest Finance: Common Errors and Suggested Solutions

23 01 2013

News flash: we all make errors when analyzing forestry investments.  Which are the most common and how can we avoid them?

At the end of the day, most analytic errors in forestry relate to the data used – the inputs – or the math in a spreadsheet.  Errors associated with inputs affect the cash flows in the analysis and how it impacts value when discounted back to the present.  When reviewing models for clients, we commonly find errors associated with the assumed costs, the estimated revenues, the timing of cash flows and the expectations associated with inflation and asset appreciation.  Specifically, in our work and the work of others, we focus on and observe three major categories of errors in Excel models and spreadsheets.

First, we find that analytic errors in Excel are common.  Of all of the spreadsheet models we review, approximately one-third have an error in a formula (that we find). Most often, these are associated with “relative” and “absolute” referencing, where a formula is pulling in data from the wrong cell or worksheet.  Professor Ray Panko at the University of Hawaii, who actually conducts spreadsheet research (http://panko.shidler.hawaii.edu/ssr/), noted in a 2006 interview with the Wall Street Journal that “you’re going to have undetected errors in about 1% of all spreadsheet formulas.”

Second, we observe application errors, which basically reference issues with the thinking behind the spreadsheet, the formula chosen, the use of a formula, or a comparison made.  For example, analysts commonly make mistakes with inflation by mixing real and nominal discount rates and cash flows.  Also, spreadsheet models of forestry investments may inappropriately compare before and after-tax results and investments of differing duration (time periods). Finally, using the incorrect metric can be problematic, such as misapplying cash-on-cash return, pay back analysis and internal rate of return (IRR).  We typically find errors of this type when analysts are comparing timberland and forestry investments with alternative asset classes, such as stocks, bonds, agricultural commodities and commercial real estate.  Historically, the day-to-day metrics for forestry differed in application, so a bit of time spent checking assumptions and thinking through the communication of results can be helpful.

Third, errors of omission are especially problematic (and embarrassing).  We work hard to avoid the situation of being asked “did you check _____?” and, if relevant, having to answer “No, we didn’t think of that.”  Ugh.  Unfortunately, we find that third-party spreadsheets often omit key facts or considerations, including relevant costs and potential revenues.  Just as important can be confirming that the assumed costs and revenues are current and reflect the best available, accessible information.  In short, know what’s knowable.

We observe a few key practices in our work with clients to minimize the chance and occurrence of errors.  First, we label tabs and worksheets, and date all files. That way, if we revisit a model several weeks or months later, we can retrace our steps and know what we’re working with.  Also, if we correct an error or make another improvement, we know which version is the most current.  Second, we try to set aside time to check each other’s work before sending results “out the door.”  Admittedly, this is also the most challenging.  We find that imposing and embracing milestones – midpoints for deliverables or reviewing work – throughout a project institutionalize a level of quality control.  Finally, at the end of the day, we ask ourselves the question “where could we have blown this?” Some level of paranoia and self-awareness is required for quality analysis of forestry, or any other, investments.

Click here to register for “Applied Forest Finance” on February 7th in Atlanta.  The course details skills and common errors associated with the financial and risk analysis of timberland and other forestry-related investments.


Forest Finance: What Does a Negative or Zero NPV Say About My Potential Timberland Investment?

16 01 2013

Attention shoppers!  An NPV of zero does not necessarily indicate “bad investment.” 

Previously, we discussed applications and limitations of using cash-on-cash (COCR) return as a metric for analyzing forestry and timber investments, as well as questions related to internal rate of return (IRR) and return on investment (ROI).  This generated a question from readers related to net present value (NPV): “Should a negative NPV automatically kill a potential forestry investment?”

Short answer: NO.  Let’s discuss.

NPV is the present value of future revenues minus the present value of future costs.  It is a measure of wealth creation relative to the discount rate.  So a negative or zero NPV does not indicate “no value.”  Rather, a zero NPV means that the investment earns a rate of return equal to the discount rate.  If you discount the cash flows using a 6% real rate and produce a $0 NPV, then the analysis indicates your investment would earn a 6% real rate of return.

Additionally, a negative NPV means that the present value of the costs exceeds the present value of the revenues at the assumed discount rate.  Any investment will produce a negative NPV if the applied discount rate is high enough.  So it makes sense to double check the estimated costs to look for opportunities to economize, to review the sources of revenue to seek potential enhancements, and to revisit the assumed discount rate.

Click here to register for “Applied Forest Finance” on February 7th in Atlanta.  The course details skills and common errors associated with the financial and risk analysis of timberland and other forestry-related investments.


Forest Finance Q&A: Cash-on-Cash Returns versus IRR and ROI for Timberland Investing

9 01 2013

While cash-on-cash (COCR) return – a percentage often used by investors to evaluate income-producing real estate – has limitations when applied to timberland investment performance, it consistently generates interest from institutional investors.  Below are questions analysts asked us about COCR:

Q:           When estimating internal rate of return (IRR) for a timberland investment since inception based on cash returns, why are timberland portfolios often zero or negative?  How can we recommend such investments?

A:            Timberland investments often have periods of low or negative cash flows, especially when timber prices are low and forest managers delay harvest activities.  In fact, noting that a given tract of timberland has negative cash flows for a given year does not tell us much at all about the quality of the investment.  For example, replanted timberlands generate negative cash flows today and may represent robust and attractive investments.

Calculating negative net IRRs that fail to include an assessment of net asset value (NAV) is like summing cash flows to date and subtracting the purchase price.  This would represent “payback analysis” misapplied.

Q:           What is the difference between return on investment (ROI) and COCR?

A:            Consider the following example:  you acquire a timberland tract for $500,000 and sell it later for $550,000. Your ROI is 10%. The 10% return ($50,000 increase on $500,000 purchase price) reflects the increase in your “total investment (Loan + Down Payment).”  If you put down 50% ($250,000), not accounting for closing costs and commissions, your cash on cash return is 20%. The return you made on invested CASH is 20% ($50,000 increase on $250,000 cash invested).  If you paid all cash for the tract, then COCR and ROI are equal.

Click here to register for “Applied Forest Finance” on February 7th in Atlanta.  The course details necessary skills and common errors associated with the financial and risk analysis of timberland and other forestry-related investments. 


Forest Finance: Cash-on-Cash Returns, Part II

6 01 2013

As noted in Part I of this series, cash-on-cash return (COCR) provides one way for real estate investors to quickly compare the profitability of different income-producing properties or investments. However, it has limits for measuring returns or wealth creation over time.  This makes cash-on-cash returns a problematic performance metric for timberland investments.

Specifically, COCR does not account for the time value of money. Cash-on-cash return must be restricted to simply measuring a residential income property’s first year cash flow and not its future year’s cash flows.  Why?  The first year’s COCR estimate will be the most accurate; each successive year becomes increasingly speculative.

Also, COCR does not account for appreciation.  Lower COCR today may lead to a greater opportunity for appreciation than acquiring a property with steady COCR and little or no appreciation.  For timberlands in particular, a meaningful analysis should account for the facts that rates of timber growth differ by age, investment objectives differ by timber portfolio, and the pace of increased values vary as forests grow and move through higher product classes in changing markets over time.

For example, buying and owning a juvenile 8-year old forest for ten years may generate minimal cash flows while appreciating in value through biological and product growth.  Alternately, buying and owning a mature 30-year old plantation may generate tremendous cash flows in the first year while appreciating minimally.  While the juvenile forest may have a low COCR, it may in fact prove a superior value creating investment when evaluated using discounted cash flow (DCF) measures such as net present value (NPV) and internal rate of return (IRR).

The next post will compare COCR to internal rate of return (IRR) and return on investment (ROI) for evaluating timber investments. Click here to register for “Applied Forest Finance” on February 7th in Atlanta.  The course details necessary skills and common errors associated with the financial and risk analysis of timberland and other forestry-related investments. 


Forest Finance: Cash-on-Cash Returns, Part I

1 01 2013

Timberland investors naturally care about the cash flows and distributions from timberland investments over time.  These cash flows vary with the products grown, markets served and age distribution of the forest owned.  Also, timberland portfolios can be constructed to meet a range of cash flow objectives.  That said, the use of cash-on-cash returns as a performance metric for timberland investments has narrow applications, if any.

What is cash-on-cash (COCR) return?  It is a measure – a percentage – often used by investors for income-producing real estate.  It is calculated by dividing before-tax cash flow by the amount of cash invested (down payment amount).  If for example before-tax cash flow for an investment property is $15,000 and our invested cash is $100,000, then COCR is 15% ($15K/$100K).

Most reported returns from timberland investments reflect unrealized gains. Timberland indices and appraisals have limitations, complicating efforts to check the status of active timber investments.  This spotlights ways to use hard measures – like cash – to assess performance.   As such, investors new to the timberland asset class often ask about the use of cash-on-cash returns for timberlands, and seek to apply it as a point of comparison.  A meaningful analysis benchmarks cash flows relative to expectations – not just the current year – and relative to comparable investment alternatives.

Part II details limitations of COCR for evaluating timber investments.  In addition, this topic will covered more fully during the February 7th “Applied Forest Finance” course in Atlanta. Click here to register.  The course details necessary skills and common errors associated with the financial and risk analysis of timberland and other forestry-related investments.