Forest Finance and Timberland Investing: Q&A

29 06 2010

Land consultant and writer Curtis Seltzer interviewed me on the topic of timberland investing and financial analysis.  One question in particular got to the heart of how I think about applying finance to forestry-related investment decisions:

“Do you use or recommend a general valuation formula for determining which investments to make, such as x% of acquisition cost in merchantable timber or a projected 10-year pay off of acquisition cost? When using DCF analysis, what minimum target do you use? Do you have non-revenue hurdles against which you measure timberland investment performance?”

Short answer: “No.”

Longer answer:  “In supporting valuation work, we focus on two things. First, we clarify, possibly to the point of annoyance, the priorities of the investor.  Being specific on this point is critical to any valuation efforts as it affects assumptions, investment periods and negotiations.  For example, a client whose objective is to own forestlands solely from a “maximizing long-term returns” perspective differs from maximizing annual cash flows which differs from clients who own forests to help source a wood-using mill or bioenergy project to clients who prioritize recreational potential…..Second, we attempt to “know what’s knowable” with respect to data for the DCF model, local wood markets, and client hurdle rates.  We have the opportunity to review valuation models from a range of investors and analysts and find that, typically, ~30% have a math or Excel error, and most have made assumptions about costs, volumes or prices that could be strengthened with minimal work.  So, in the DCF, we want, to the extent possible, “know what’s knowable” and get it right relative to the investor’s priorities.  If we’re not clear on what the investor values, the DCF can provide a valuation inconsistent with the true ownership objectives.”

To read the complete interview with Curtis, please click here.

Our upcoming “Applied Forest Finance” course in Atlanta on August 4, 2010 teaches practical tools and strategies for applying financial analysis and criteria to forestry and timberland-related investments.  For course information, please click here.


Wood Bioenergy Update: Forisk Expanding Coverage Nation-wide

26 06 2010

Forisk has expanded its coverage of operating and announced wood-using bioenergy projects from the US South to the continental US.  Next month’s post will include a summary of national wood bioenergy activity.  For information regarding the detailed US-wide bioenergy database, please click here.

Specific to the US South, as of June 24, 2010, our analysis of bioenergy markets indicates:

  • 136 wood-using bioenergy projects are operating or have been announced in the US South.
  • In total, these projects represent potential, incremental wood use of 56.4 million tons/year by 2020.
  • Based on Forisk analysis, projects representing 20.8 million tons/year pass basic viability screening.

Click on the figure for the detailed downloadable summary.


Wood Bioenergy in the US: Recent Analyses Provide Incomplete Story

21 06 2010

Recent analysis and reporting of wood bioenergy markets in the US fail to take into account the prohibitive economics and back-bending logistics required to successfully start, build and operate wood-using bioenergy projects.  First, the Environmental Working Group published a white paper which asserts that “generating 25 percent of U.S. electricity from renewable sources by 2025 would require the equivalent of clear-cutting between 18 million and 30 million acres of forest” (Clearcut Disaster: Carbon Loophole Threatens U.S. Forests).  Second, The New York Times published an article highlighting potential environmental impacts from and skepticism of bioenergy projects in Massachusetts (“Net Benefits of Biomass Power Under Scrutiny June 18, 2010).  While both assessments raise legitimate issues about carbon accounting and policy, neither provides the context required to truly assess the potential, likely and realistic impacts from wood bioenergy markets.

Forisk tracks and assesses all publicly-known and announced wood-using bioenergy projects in the continental US.  As of June 15, 2010, this included 351 projects with potential, incremental wood demand of 104.8 million green tons by the year 2020 (see table below).  Of this demand, our analysis indicates 58.7 million tons (56%) is viable.  The methodology used to evaluate these projects is detailed in a recent posting and white paper published by the National Alliance of Forest Owners.


Real vs Nominal Discount Rates for Timberland: More than a Rounding Error

14 06 2010

Several years ago, an analyst from a hedge fund called me to discuss suitable discount rates for timberland investments.  We had the following exchange:

“A common error with discount rates is that folks use real and nominal rates inconsistently,” I said.

“Who cares?  Mixing real and nominal is just a rounding error,” responded the analyst.

Ex-squeeze me? Baking powder? Clearly distinguishing real rates – which do not include inflation – from nominal rates – which do include inflation – in our forestry and timberland valuation models matters tremendously.  While the impacts of inflation over short time periods (i.e. under one or two years) may be irrelevant, the effects of inflating costs and revenues over a 10-year timberland investment or 30-year forestry rotation do represent the difference between a mountain and a molehill.  The error manifests itself when valuation models assume inflation in costs,  but not in revenues, or vice versa.  An example, please.

Assume a brief, 5-year timberland investment with the following characteristics:

  • Price paid:  $1,000 per acre
  • Harvest volume:  5 tons per year
  • Average stumpage price, net:  $20 per ton
  • Taxes & administration:  $10 per acre per year
  • Real discount rate:  6%
  • Inflation:  2%
  • Nominal discount rate:  8.1%
  • Price sold:  $1,000 per acre (in real terms)

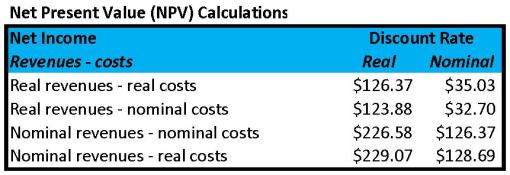
The table below shows the range of potential NPVs resulting for mixing real and nominal revenues and costs, in addition to discounting annual net cash flows (“net income” in this example) with real versus nominal rates.

Note that using real revenues, real costs and a real discount rate produces an NPV of $126.37, which is identical to using nominal revenues, nominal costs and a nominal discount rate.  The key is consistency.

*This theme will be addressed further during the “Applied Forest Finance” and “Valuing Timber REITs” courses on August 4, 2010 in Atlanta, Georgia


Practical Guide for Tracking Wood-Using Bioenergy Markets

9 06 2010

Locating, financing, constructing and operating wood-using bioenergy projects go beyond drafting a pro forma and wishing upon a star.  The reality is complicated, difficult and time-consuming.   Last year, we developed a methodology to help forest owners and other wood-market participants assess likely demand from new wood bioenergy projects in their local markets in the future.   This year, the National Alliance of Forest Owners (NAFO) supported a white paper that introduces this tool to policy makers.

The methodology for screening wood-using bioenergy projects focuses on two criteria: technology and status:

  • Technology:  Projects that employ currently viable technology pass the status screen.  These include pelletizing technology and wood-to-electricity projects.  Cellulosic ethanol from wood feedstock, as a developing technology, is not yet considered operational using this approach.
  • Status:  Projects that are operational, under construction, or received or secured two or more necessary elements for advancing towards operations pass the status screen.

The whitepaper and the most recent bioenergy market projection are available here.

The complete NAFO/Forisk press release is available here.


Forisk Hires Director of Equity Research

3 06 2010

We are thrilled to announce that Neena Mishra has joined our team as Director of Equity Research.  Neena brings twenty years of experience in equity research and fixed income analysis, risk management and central banking.  In addition, she has conducted research on public timber REITs and capital structure in the forest products industry.  For example, she co-authored with Dr. Tim Sydor, our forest economist, and with me the first peer-reviewed study of public timber REITs, “Investor Responses to Timberlands Structured as Real Estate Investment Trusts.”  The results were published in the Journal of Forestry in 2008.

Our Equity Research Program has grown with the increased demand for independent and comparative analysis of timberland investment vehicles.  Today, multiple timberland investment managers use the Forisk Timber REIT (FTR) Index as a public-sector benchmark for private timberland investments.  In July, we will relaunch Forisk Finance (formerly the Timber REIT Report) to provide on-going, bi-quarterly analysis of timberland investments, timber REITs and forest economics.  In October, Neena will initiate our coverage of public timber REITs.

I look forward to introducing many of you to Neena in the near future.  Not only does she possess rigorous analytical skills, she brings the sense of ownership you look for from successful researchers.  In addition, she is an excellent teacher and will support our “Applied Forest Finance” and “Valuing Timber REITs” courses on August 4th in Atlanta.


Timber Supplies: Mountain Pine Beetle Update and Timberland Investment Implications

1 06 2010

The Mountain Pine Beetle (MPB) – like a ravenous, insatiable house guest – continues to feast on pine forests, primarily in British Columbia.  Fortunately, according to the most recent update from researcher Adrian Walton of the BC Forest Service (May 11, 2010), the worst of the attack has passed, MPB attacks have declined annually since 2005, and initial projections overstated the likely, total pine killed through 2020.  The updated projections reinforce the view we’ve shared for the past two years that the preliminary estimates likely overstated the long-term implications – good and bad – for stumpage forecasts and timberland investments.  Why?  Here are key points:

  • Devastating:  the update projects 65% of the pine volume in the study region will be killed by 2016.  This is down from previous estimates of 80%.  From any perspective, these are astounding and catastrophic assessments.  However, they do not account for…..
  • Mitigating factors:  the projections do not account for mitigating factors associated with forest management decisions, adjustments to harvest schedules, salvage operations, and an improved understanding of how long dead timber can be left standing and salvaged later.  This, in turn, emphasizes the importance of distinguishing between….
  • Local and national markets:  the MPB infestation most directly generates questions from timberland investors and lumber manufacturers.  Timber is a regional (local) business; lumber is a national one.  While reduced lumber imports from Canada can lift manufacturers nationwide in the US, additional benefits accrue to regional timberland owners in the Pacific Northwest as the ratio of buyers to available stumpage shifts in their favor.  Yet, these changes are further mitigated by…..
  • Housing market realities:  as of January 2010, US government forecasts assumed housing starts for 2010 of 982,000.  Revised estimates approach 600,000.  In addition, average home sizes – and thus the volume of lumber required per home – are falling.  This further smooths potential price spikes from MPB-related timber shortages.  In short, current lumber market conditions alleviate longer-term economic implications.